Background
A random walk is a path created by a series of choices, each of which is left entirely to chance. Random walks have practical applications in several areas of academia such as physics and economics.
For this case, each step will consist of a randomly chosen set of coordinates (each between -4 and 4). This python program can produce simple to complex random walks by changing the number of points (the default number of points is 10,000). Figure 1 below represents a random walk with the default number of points. The beginning starts at the green dot, and the gradient represents the path (from light to dark).
Setting Up the Random Walk Class
# First, from the random module import choice
from random import choice
Creating the Random Walk Class
A class was perfect to use in this case since the code consisted of several parts, each of which had its’ own task. I created a set of empty lists, one for the x values and one for the y values.
The get_step function is the main section of this class. First, the program randomly selects the direction and distance of a point using the choice method. I calculated the step by multiplying the direction and distance, meaning the possibilities for each step are [-4, 4].
Each step is then added to the last value stored and appended to its respective list within the fill_walk function. The while loop runs this process until it has reached the number of points requested by the user.
class RandomWalk:
    """A random walk generator"""

    def __init__(self, num_points=10000):
        """Initialize attributes"""
        self.num_points = num_points

        # Create lists that will hold all x and y points
        # all walks start at (0,0)
        self.x_values = [0]
        self.y_values = [0]

    def get_step(self):
        """Calculate all the points in the walk"""
        # Choose positive or negative (Cartesian coordinate system)
        direction = choice([-1, 1])
        distance = choice([0, 1, 2, 3, 4])  # choose distance
        step = direction * distance
        return step

    def fill_walk(self):
        """Insert and append calculated steps to list"""
        # Keep taking steps until num_points has been reached
        while len(self.x_values) < self.num_points:

            # 'get_step' decides direction and how
            # far to go in that direction
            x_step = self.get_step()
            y_step = self.get_step()

            # Do not append if x and y step = 0
            if x_step and y_step == 0:
                continue

            # Calculate new step
            x = self.x_values[-1] + x_step
            y = self.y_values[-1] + y_step

            # Add points to list
            self.x_values.append(x)
            self.y_values.append(y)
Plotting the Random Walk
To plot the random walk, make sure to import pyplot from matplotlib. Import the class randomwalk from the file randomwalk.py.
import matplotlib.pyplot as plt

from randomwalk import RandomWalk
The interesting part of this project is exploring the various plots that the random walk program generates. That is why all the code for the visualization is inside a while loop. Anytime the user closes a plot, the program will ask if they would like to generate a new one.
# Keep making new walk visualizations as long as the user wants to.
while True:
    # Create an instance of RandomWalk class.
    rw = RandomWalk()
    rw.fill_walk()

    # Set up plot
    plt.style.use('classic')
    fig, ax = plt.subplots(figsize=(15, 9))  # figsize arg sets size of figure using tuple.
    point_numbers = range(rw.num_points)  # rw.num_points used as num_points can be changed, used for cmap.
    ax.scatter(rw.x_values, rw.y_values, c=point_numbers, cmap=plt.cm.Blues, edgecolors='None', s=7)

    # Emphasize first and last points of random walk.
    ax.scatter(0, 0, c='green', edgecolors='None', s=100)
    ax.scatter(rw.x_values[-1], rw.y_values[-1], c='red', edgecolors='None', s=100)

    # Customize labels.
    ax.set_title('Random Walk', fontsize=14)
    # Removing axes
    ax.get_xaxis().set_visible(False)
    ax.get_yaxis().set_visible(False)
    plt.show()

    run_again = input('Make another random walk? (Y/N)?: ')
    if run_again.title() == 'N':
        break
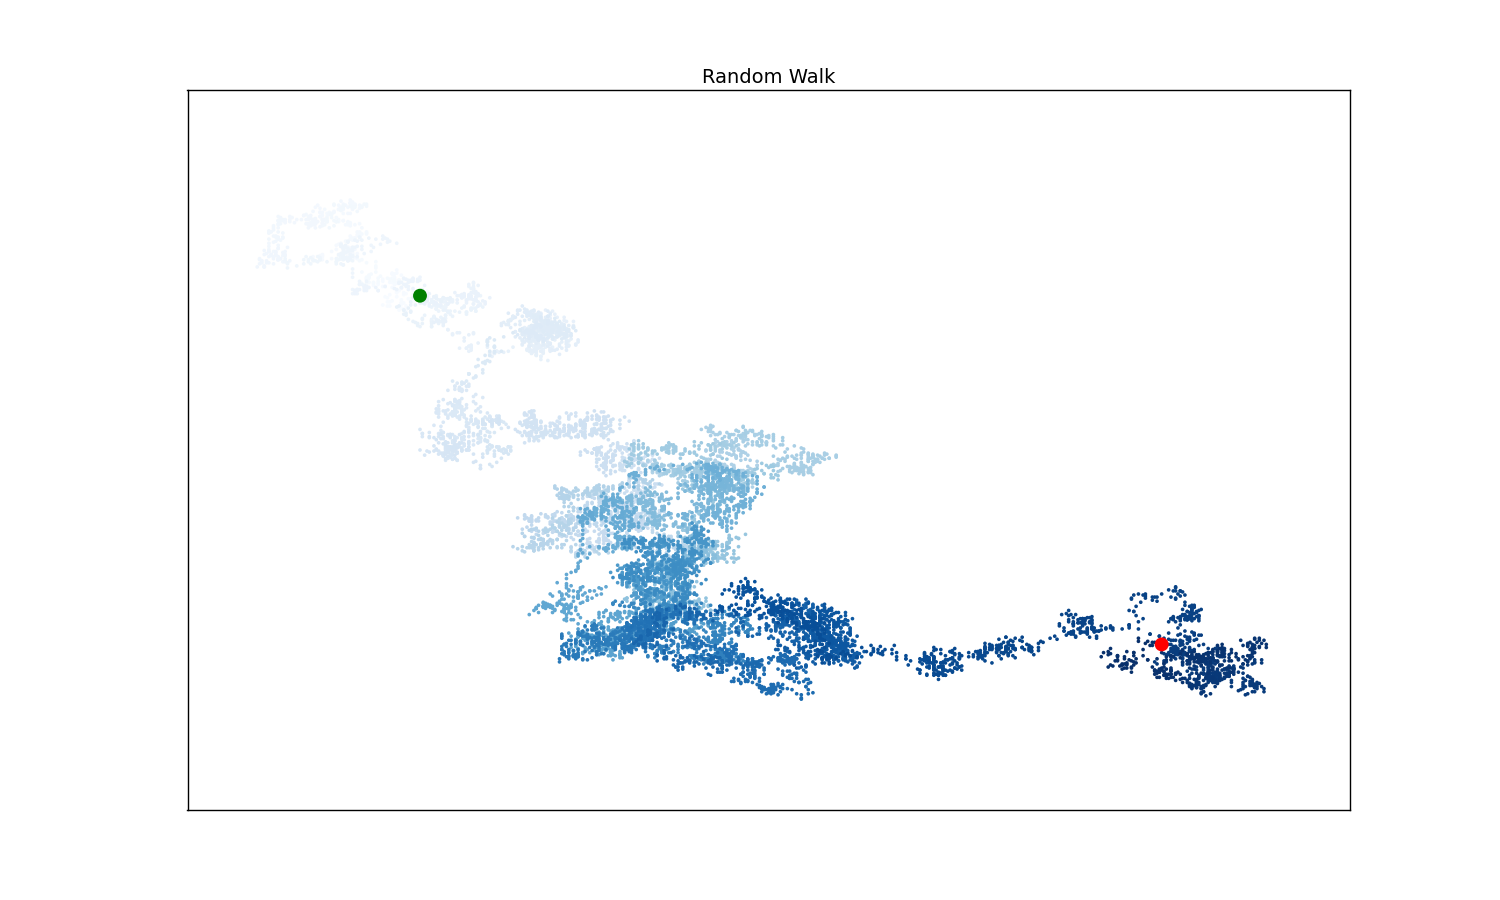 Figure 1: A simulated random walk with 10,000 points